
Nvidia GeForce Tweak Guide
[Page 10] Advanced Tweaking (Pt.2)
Hardware Monitoring & Overclocking Tools
To ensure that your GPU is performing optimally, and to help troubleshoot any problems you may be experiencing in games, you will need to use a hardware monitoring tool. There are numerous free tools available that allow you to actively monitor various aspects of your graphics card and system, drawing their readings from the onboard sensors of your GPU, CPU and motherboard. Additionally, some of these tools allow you to manually alter certain hardware-based features, such as fan speed, clock speeds and voltage. I cannot devote the large amounts of space in this guide necessary to cover all of the multitude of hardware monitoring and overclocking tools. In any case, only one or two of these tools are necessary for the majority of your needs, and I examine what I consider to be the best ones in detail below.
For basic hardware monitoring needs, the free GPU-Z utility is perfectly adequate. Some of its useful functionality has already been covered on page 3 of this guide, but here we look at the hardware monitoring features it provides under its Sensors tab. Since GPU-Z is lightweight, does not require installation to use, and has a user-friendly interface which requires minimal configuration, it is a handy first choice for quick and easy hardware monitoring.
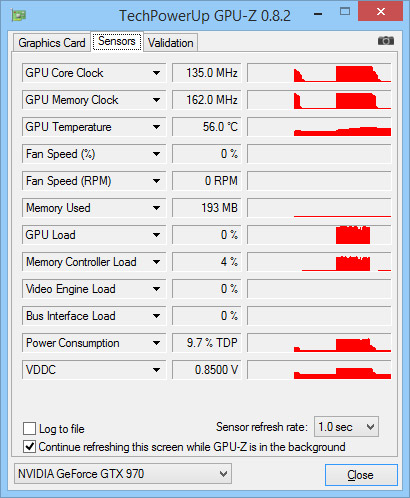
The GPU-Z Sensors window shows all of the key GPU readings, including GPU clock speeds, GPU temperature, Fan speed, Memory (Video RAM) used, total GPU load, and Power usage. By default, GPU-Z shows the current reading for each category, refreshed every second, and next to that, a red graph of that category's readings over the past (approx.) 2 minutes. You can adjust the hardware polling rate - the frequency with which hardware readings are taken from the sensors and shown in GPU-Z - by altering the Sensor Refresh Rate setting, ranging from ten times a second (0.1 sec) to once every ten seconds (10 sec). Importantly, as noted earlier, be aware that a hardware polling rate that is too frequent can cause stuttering in games when GPU-Z is running in the background. The default of once every second (1.0 sec) should be fine.
To use GPU-Z for monitoring your GPU's performance, first make sure that the Continue Refreshing This Screen While GPU-Z Is In The Background box is ticked at the bottom of the GPU-Z window, so that it continues monitoring hardware readings when a game is running in the foreground. Next, you have two alternatives: for very basic hardware monitoring, launch a game while GPU-Z is running in the background, then when you eventually quit the game, go to GPU-Z, left-click on the small black down arrow in the category name you're interested in and select Show Lowest Reading or Show Highest Reading to get an indication of the extremes for that category, or select Show Average Reading for an average. This is useful for example if you quickly wish to see the highest temperature your GPU reached over the period in which the game was running.
The second alternative is more precise, as it allows you to see (and graph if you wish) all of the individual reading values over time. To do this, you must first tick the Log To File box at the bottom of the GPU-Z window, and specify a location for the .TXT text log file which will hold GPU-Z's data output. You can also specify which categories get logged by left-clicking on the small black down arrow in the category name you're interested in and either ticking or unticking the Log To File item. Now launch a game, and once you eventually quit it, to finish text file logging untick the Log To File box or quit GPU-Z. To best view the resulting log file, open it Microsoft Excel (or similar spreadsheet program), selecting to import the .TXT file as a Delimited file, with Comma as the delimiter, which will format the output correctly for display and graphing.
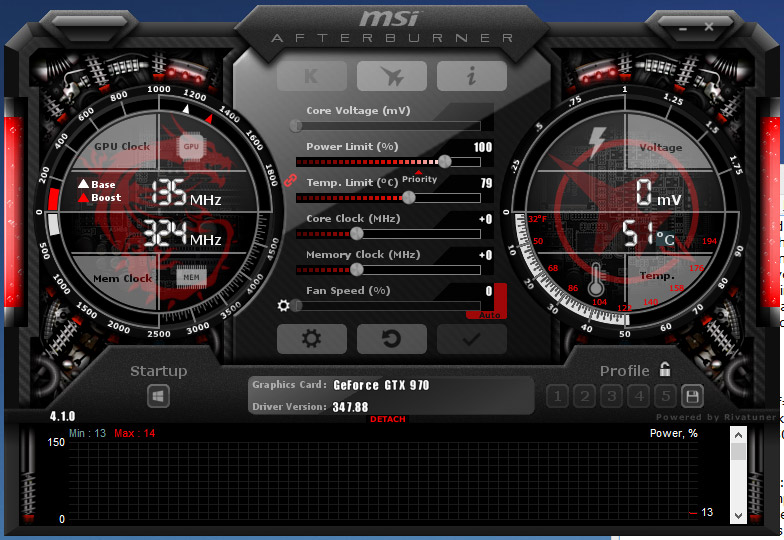
The MSI Afterburner utility is a far more comprehensive hardware monitoring tool. Its framerate counter, screenshot and video capture capabilities have already been covered on the previous page, so here I detail its other features, including of course hardware monitoring, as well as overclocking.
Although it's provided by MSI, Afterburner works on all brands of Nvidia GPUs, and is completely free. Like the extremely similar EVGA PrecisionX utility, Afterburner's core functionality is powered by Rivatuner Statistics Server (RTSS), which can be downloaded separately if you wish. For this reason, when installing Afterburner make sure the Rivatuner Statistics Server component is ticked. The descriptions that follow are specific to Afterburner and its interface, but should equally apply to the other utilities based on RTSS if you want to use them instead - note though that On-Screen Display support in 64-bit games is only guaranteed in Afterburner and RTSS.
Aside from being highly configurable, a major reason why Afterburner is so useful for hardware monitoring is because it provides a detailed On-Screen Display (OSD). The OSD allows you to monitor hardware readings on a small overlay on the screen while playing a game or running a benchmark, rather than recording them in the background. This makes it much easier to track changes in readings in real time, and correlate them with certain events in the game. For example, if a game starts stuttering and your OSD reading suddenly shows very high VRAM usage, you can readily deduce that the stuttering is primarily caused by saturation of your video memory, and thus in the first instance you can lower relevant game settings, such as texture quality or antialiasing, to attempt to alleviate it.
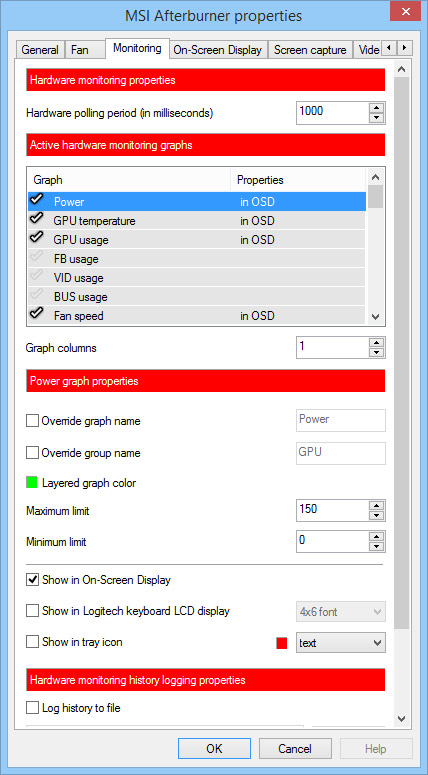
To configure the hardware monitoring in Afterburner, click the small cog icon in the center of the Afterburner interface to open the Properties window. Go to the Monitoring tab, and under the Graph section you will see a long list of hardware monitoring categories which you can scroll through. Any item with a tick next to it is being actively monitored by Afterburner. To select or unselect any item for monitoring, first left-click on its name, then left-click once on the checkmark to its left to tick or untick it. A tick means that item is being monitored, and also graphed in the small graph section at the bottom of the main Afterburner interface. If you also want a ticked item to be shown in the On-Screen Display, then left-click on its name and go down to the Show in On-Screen Display box further below the Graph section, and place a tick in it. The item should now show In OSD under its Properties.
You can adjust the hardware polling rate - the frequency with which hardware readings are taken from the sensors and shown in Afterburner - by altering the value shown in the Hardware Polling Period box at the top of the Monitoring tab. The default is 1000 milliseconds, which is equivalent to once every second. As noted earlier, a hardware polling rate that is too frequent can cause stuttering in games when Afterburner is running in the background.
You can also add more sensor readings to be monitored and shown on the OSD by installing the free HWiNFO utility. Launch HWiNFO, and tick the Sensors-only box, then click Run. A large list of sensor readings from across your system will be shown. To add any of these sensor readings to the Afterburner OSD, click the cog icon at the bottom of the HWiNFO window, go to the OSD (RTSS) tab, select the sensor name, and tick the Show Value in OSD box at the bottom - you can also tick the Show Label in OSD box if you want the sensor name shown as well. Click OK when done, and while both Afterburner and the HWiNFO Sensor Status screen are running in the background, all selected sensors will be shown in the OSD when in-game.
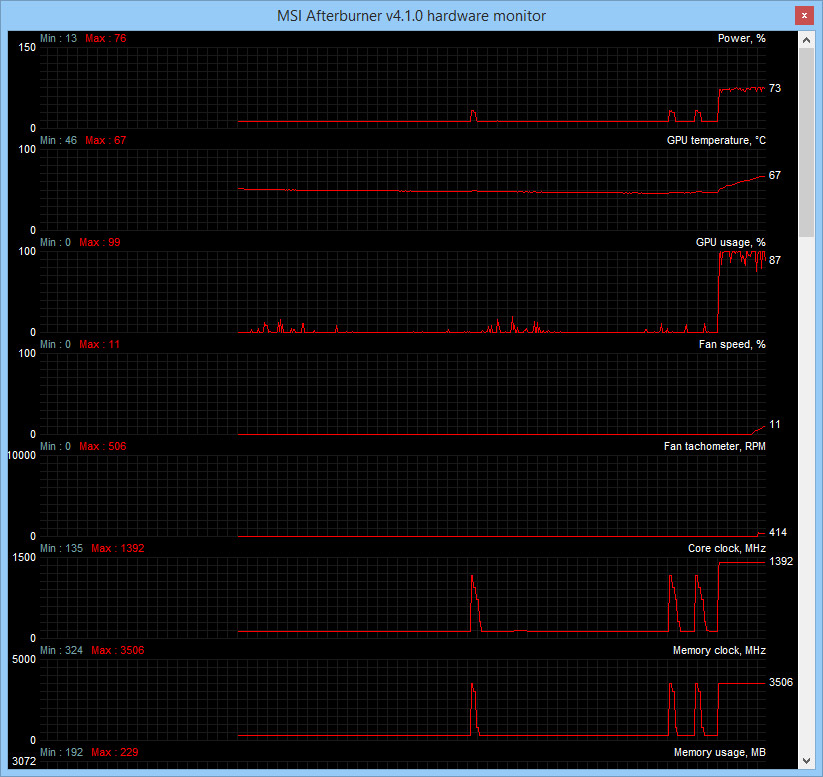
To view the full set of hardware monitoring graphs, go to the main Afterburner interface and look at the very bottom of it - a single graph is shown, but you can use the scroll bar at the right to scroll through and look at the other monitoring categories you ticked under the Monitoring tab. To better view the graphs, click Detach and the graphs will open in a separate window, which you can resize to be much larger.
To record the monitoring data for later (re)viewing in graph form, use Afterburner's built-in file logging capability: tick the Log History To File box under the monitoring tab. Select a location for this HardwareMonitoring.hml file, and click OK to start logging to the file. However, unlike the simple text file generated by GPU-Z, Afterburner's log file can easily be viewed as a proper set of graphs by clicking the View button at the bottom of the Monitoring tab, selecting the saved HardwareMonitoring.hml file, and then left-clicking on the log session you want to view at the top of the window that opens. A full set of graphs will be displayed.
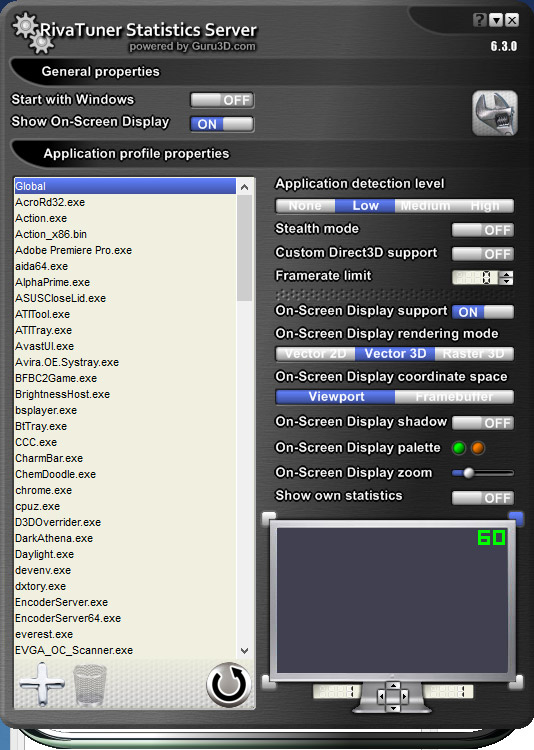
To configure the OSD in more detail, go to the On-Screen Display tab of the Afterburner Properties. The main setting of note here is Toggle On-Screen Display, allowing you to assign the key(s) which turn the OSD on and off within a game. For more comprehensive OSD configuration options, click the More button - the Rivatuner Statistics Server properties screen will open. Key OSD properties you can customize here include: selecting the position of the OSD text on screen using the graphical representation of a monitor at the bottom; changing the OSD text size using the On-Screen Display Zoom slider, with any changes in OSD size reflected in the size of the "60" text shown on the monitor beneath; changing the color of the OSD text by clicking the first radio button, selecting a color from the list or creating a custom color, and clicking OK - once again, any changes in OSD color are reflected in the color of the "60" text shown on the monitor beneath. The other options are best left at their defaults for now. Click the X at the top right to save and exit the RTSS properties.
Leaving Afterburner running in the background, now launch a game, and the OSD text should appear in the corner you specified, showing its various readings. Interpreting these readings in all of the different scenarios which can occur in games is a lengthy topic and well beyond the scope of this guide. But the fact remains that, combined with some research, the OSD can be an invaluable tool in detecting and determining the specific cause of a problem you are experiencing in a game.
Once you've set up the hardware monitoring and OSD features of Afterburner, you can turn to trying out another one of its core features: overclocking. Overclocking is the process of increasing the clock speeds of the GPU beyond factory specifications in order to increase performance. On a GPU, there are two clock speeds - the Core clock (a.k.a GPU Clock), which controls the speed at which graphics data is generated; and the Memory clock, which controls the speed with which data is transferred into and out of Video RAM. Increasing one or both of these can improve performance, but the size of the improvement varies depending on the game and how stressful it is on the Core and/or Memory. At the same time, increasing clock speeds increases power consumption and generates more heat, requiring additional cooling effort. At a certain point, the GPU will become unstable and generate graphical errors, or even driver or system crashes.
The general process of GPU overclocking can be summarized as follows: slowly increase the memory and core clocks in small increments, while monitoring temperatures, system stability and graphical fidelity in a stressful game or benchmark. Since overclocking is a complex topic that could fill up a guide on its own, it can't possibly be covered in thorough detail here. To understand the fundamentals of overclocking your system components, refer to the Overclocking section of the TweakGuides Tweaking Companion. For more specific details on overclocking a GPU, see this Basic Overclocking Guide. If you want to use a utility other than Afterburner to overclock your GPU, see this Guide to Overclocking Software. I also recommend doing a web search for instructions and user experiences with overclocking on your exact model of GPU. This will give you the best indication of the kinds of maximum clock speeds, safe voltages and temperatures, and the type of cooling required, reducing the risk and saving you hours of experimentation.
To make basic overclocking easier, putting it within the reach of all GPU users, as of the GTX 600 series, Nvidia GPUs now automatically overclock themselves using a feature called GPU Boost, upgraded to GPU Boost 2.0 as of the GTX 700 series onwards. This is the safest form of overclocking, because of the way GPU Boost works. It starts off by always running at guaranteed minimum clock speeds, called Base Clocks. Boost then actively monitors the GPU's power usage and/or temperature, and when these are below the set power or temperature target (depending on which is prioritized), the GPU will raise its clock speeds, called Boost Clocks, until it hits the target power or temperature. This prevents the risks associated with traditional overclocking, whereby it was very easy to over-overclock the GPU and cause harm to it; with GPU Boost, the GPU only overclocks when there is safe headroom.
If your GPU supports GPU Boost, then a tool like Afterburner allows you to adjust the Power Limit and Temperature Limit for the Boost functionality. You can also manually alter the Core Clock and Memory Clock speeds, and set a custom Fan Speed to adjust cooling and thus achieve a desirable balance between temperatures and fan noise depending upon your needs. Again, refer to the guides linked further above for specific examples of how and when to adjust these settings.
Forcing Triple Buffering
Triple Buffering, and the benefits it provides when Vertical Synchronization (VSync) is enabled, are covered in detail under the Triple Buffering and Vertical Sync settings on page 8 of this guide. To recap, whenever VSync is on, it can also significantly reduce performance if your framerate falls below your monitor's refresh rate. Enabling Triple Buffering prevents this performance drop. The only problem is that most games don't have a Triple Buffering setting, and the Triple Buffering which can be forced through the GeForce driver via the Nvidia Control Panel option only works for OpenGL games, whereas the majority of games use DirectX.
The solution is to attempt to force Triple Buffering in DirectX games using a small tool called Direct3D Overrider (D3DOverrider), which comes as part of the free Rivatuner utility. Rivatuner, unlike its newer cousin Rivatuner Statistics Server (as covered earlier), ceased being updated back in 2009. However it's currently the only way to safely obtain D3DOverrider. Fortunately D3DOverrider is a standalone tool, so once RivaTuner is installed, go to the \Program Files (x86)\RivaTuner...\Tools\ directory, and you can move the entire D3DOverrider directory to another location, then uninstall Rivatuner.
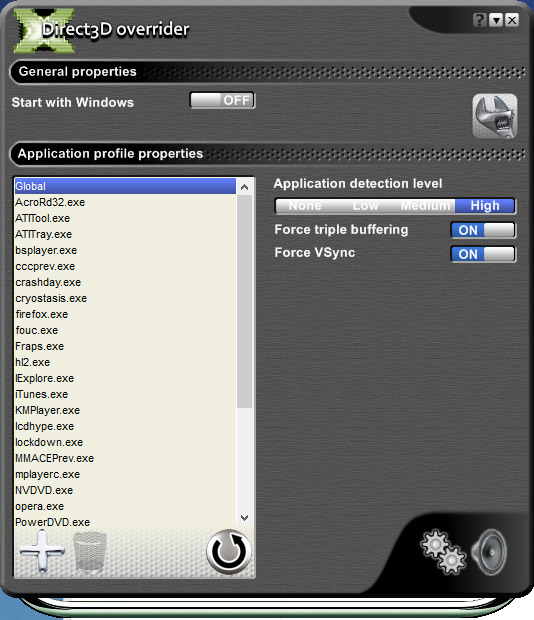
To force Triple Buffering in a game, first launch the D3DOverrider.exe file, as it needs to be running in the background to work. To configure D3DOverrider, click its icon in the Notification Area. Make sure the Force Triple Buffering setting is On; Force VSync can be also be left On, given Triple Buffering is only useful if VSync is enabled. The Application Detection Level will need to be set to High for D3DOverrider to work in most modern games.
Now whenever you want to run a game with Triple Buffering, first make sure D3DOverrider is running in the background, then launch the game as normal. As the game is launched you'll hear a small notification sound indicating that D3DOverrider is working. VSync will be enabled to prevent tearing, but Triple Buffering will also be enabled and will work to counter the negative performance impact of VSync.
The Advanced Tweaking section concludes on the next page.
|
|